
One Site, Four Layers: How Aerial Survey Uncovers What the Ground Hides
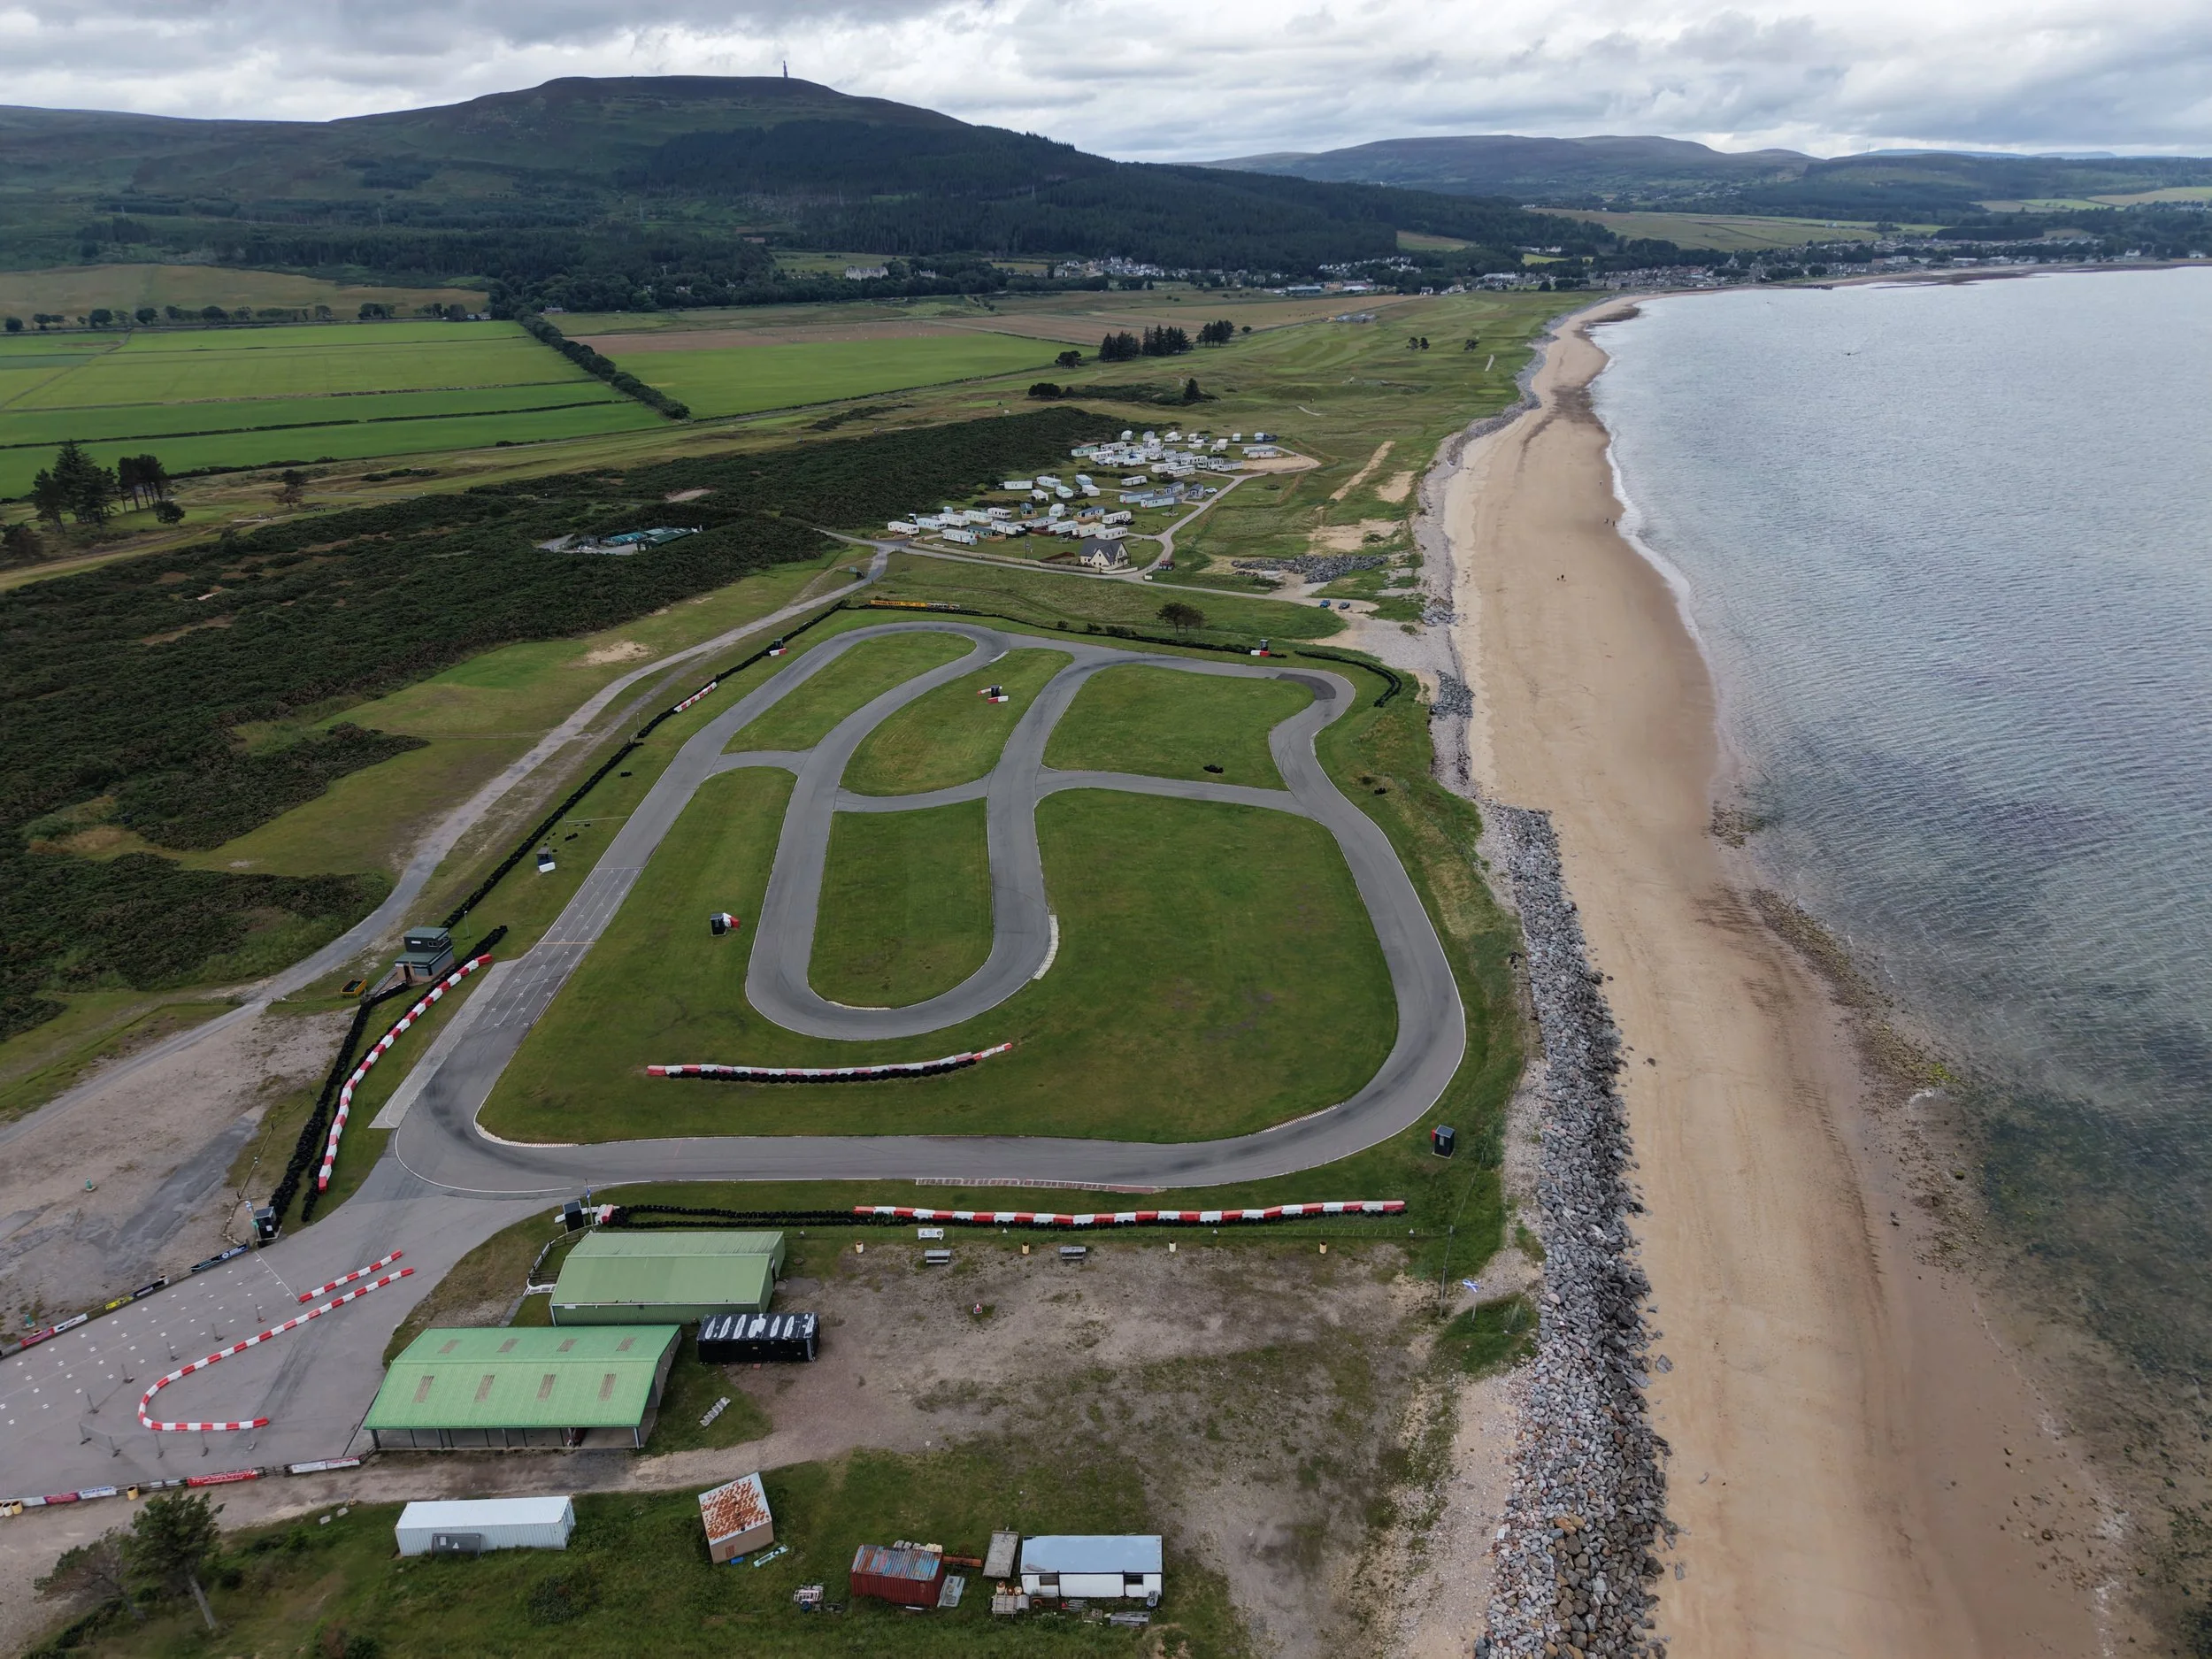
Drone photo of Karting track and surrounding ageing woodland
On a grey morning in early July, I took the drone down to Littleferry on the Sutherland coast for a survey. What began as a practice flight turned into something more interesting: a full landscape reading of a piece of ground I thought I knew.
This is what aerial survey actually does. It reveals what walking the ground never quite shows you.
The site
Littleferry sits at the mouth of Loch Fleet, just south of Golspie. A narrow strip of reclaimed coastal ground, part links, part woodland, part sports and leisure use. From the ground it looks like an ordinary piece of Sutherland shoreline. From the air, its layered history begins to read clearly.
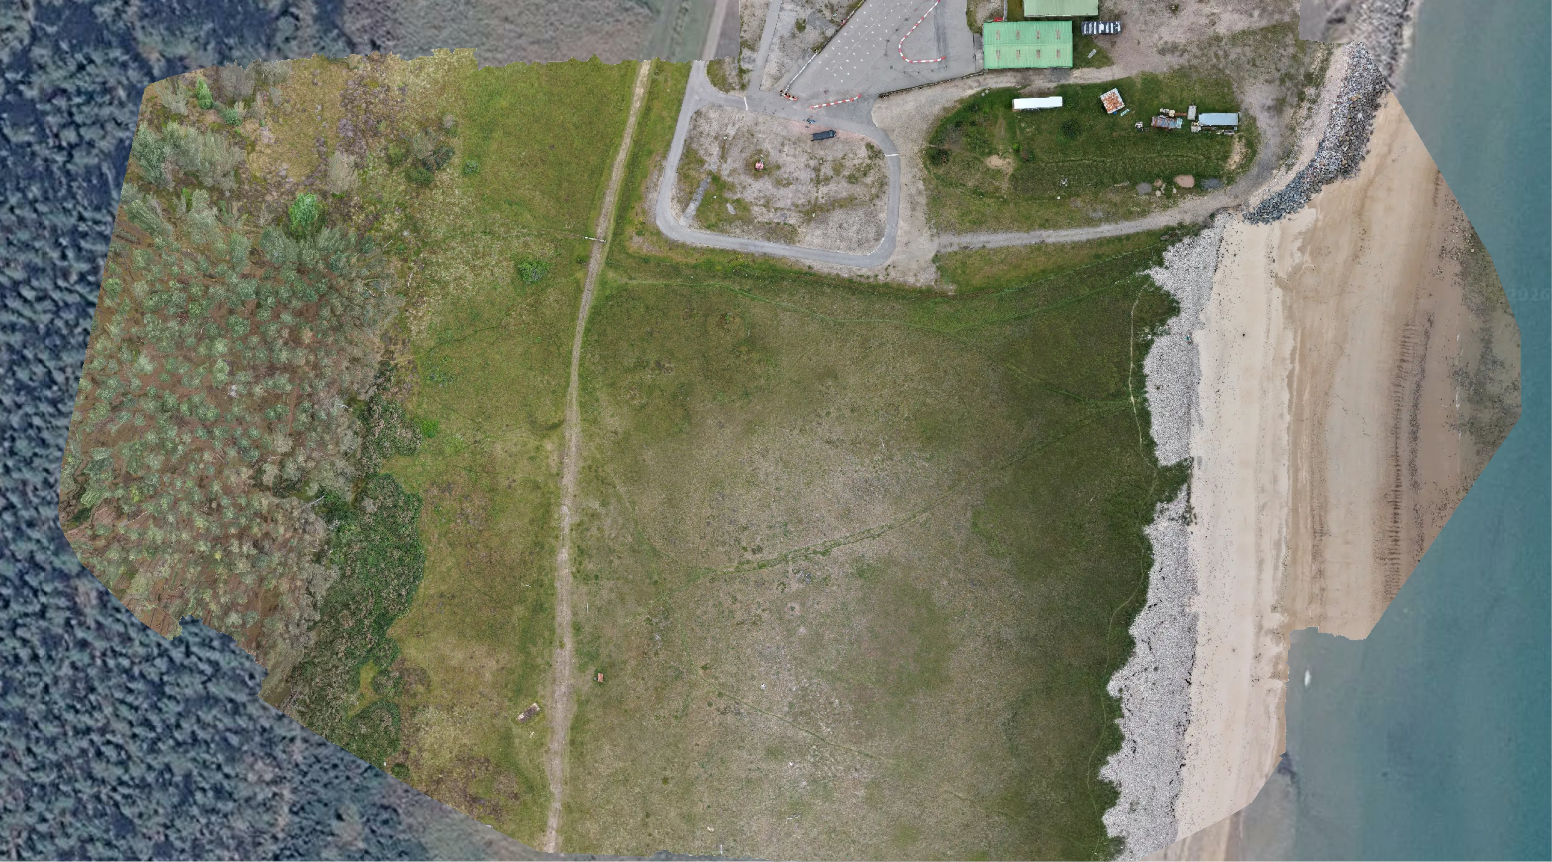
Orthomosaic image composited on Google Maps
The first output from any drone survey is the orthomosaic. Thirty-two images captured at ninety metres, stitched together and geographically corrected so they sit accurately over the wider landscape. In one morning you have a professional aerial map of the site at a resolution and freshness no satellite imagery can match.
Reading the topography
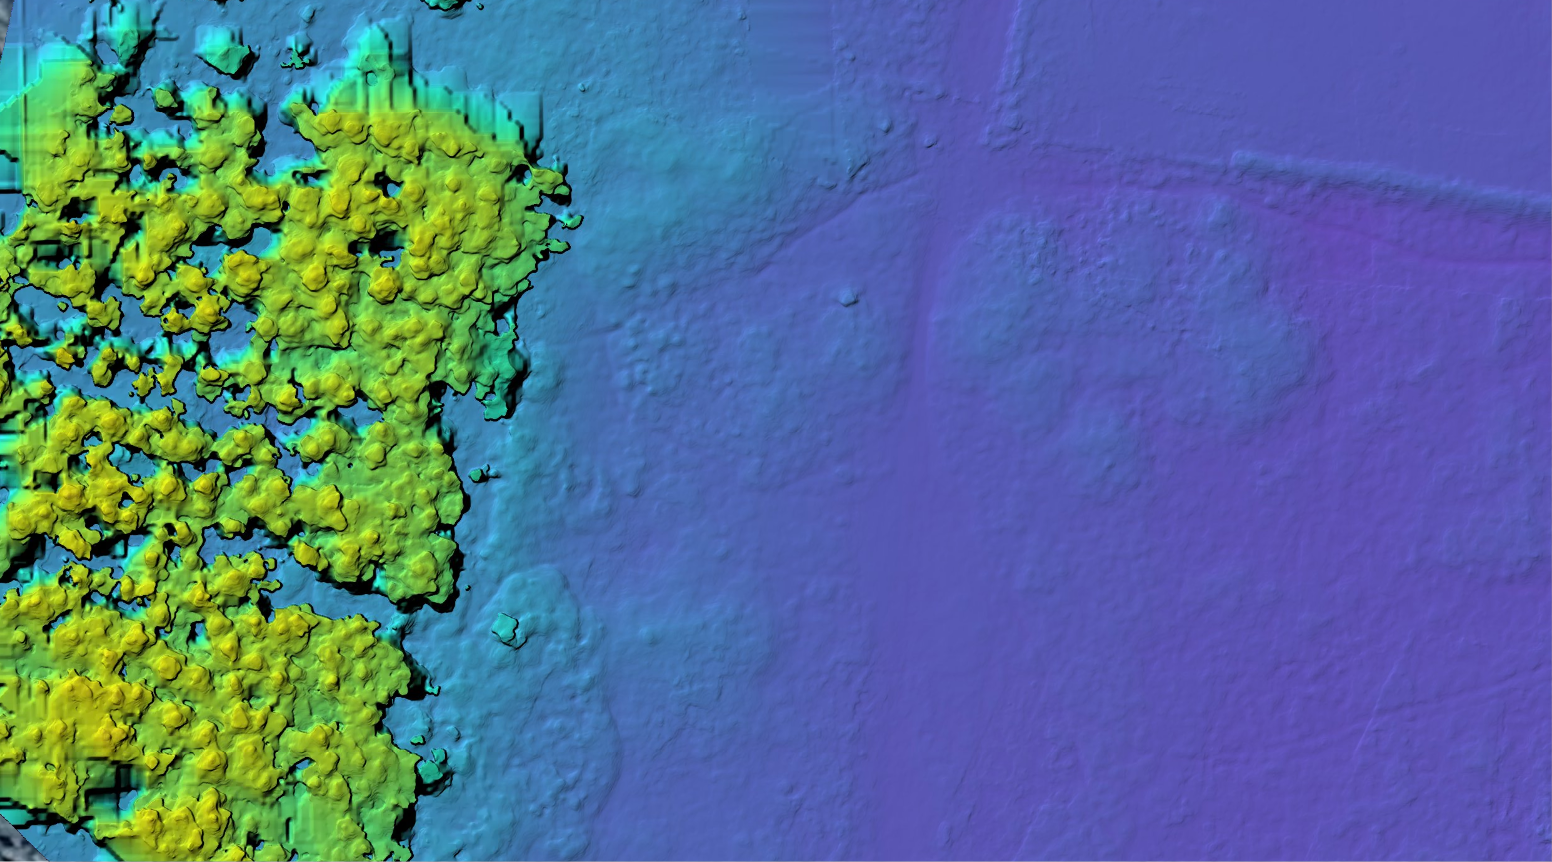
Digital Surface Model
Photogrammetry doesn't just produce imagery. It produces measurable spatial data. The digital surface model shows the site as a three-dimensional record: the woodland canopy rising in yellow off the flat blue ground plane, the buildings registering as distinct raised blocks, the subtle undulations of the reclaimed ground revealed in ways the naked eye simply cannot see.
For an estate, this is the kind of baseline record that has real long-term value. It captures the site as it is today, at high resolution, at a moment in time. Everything that happens next has something to be measured against.
The vegetation story
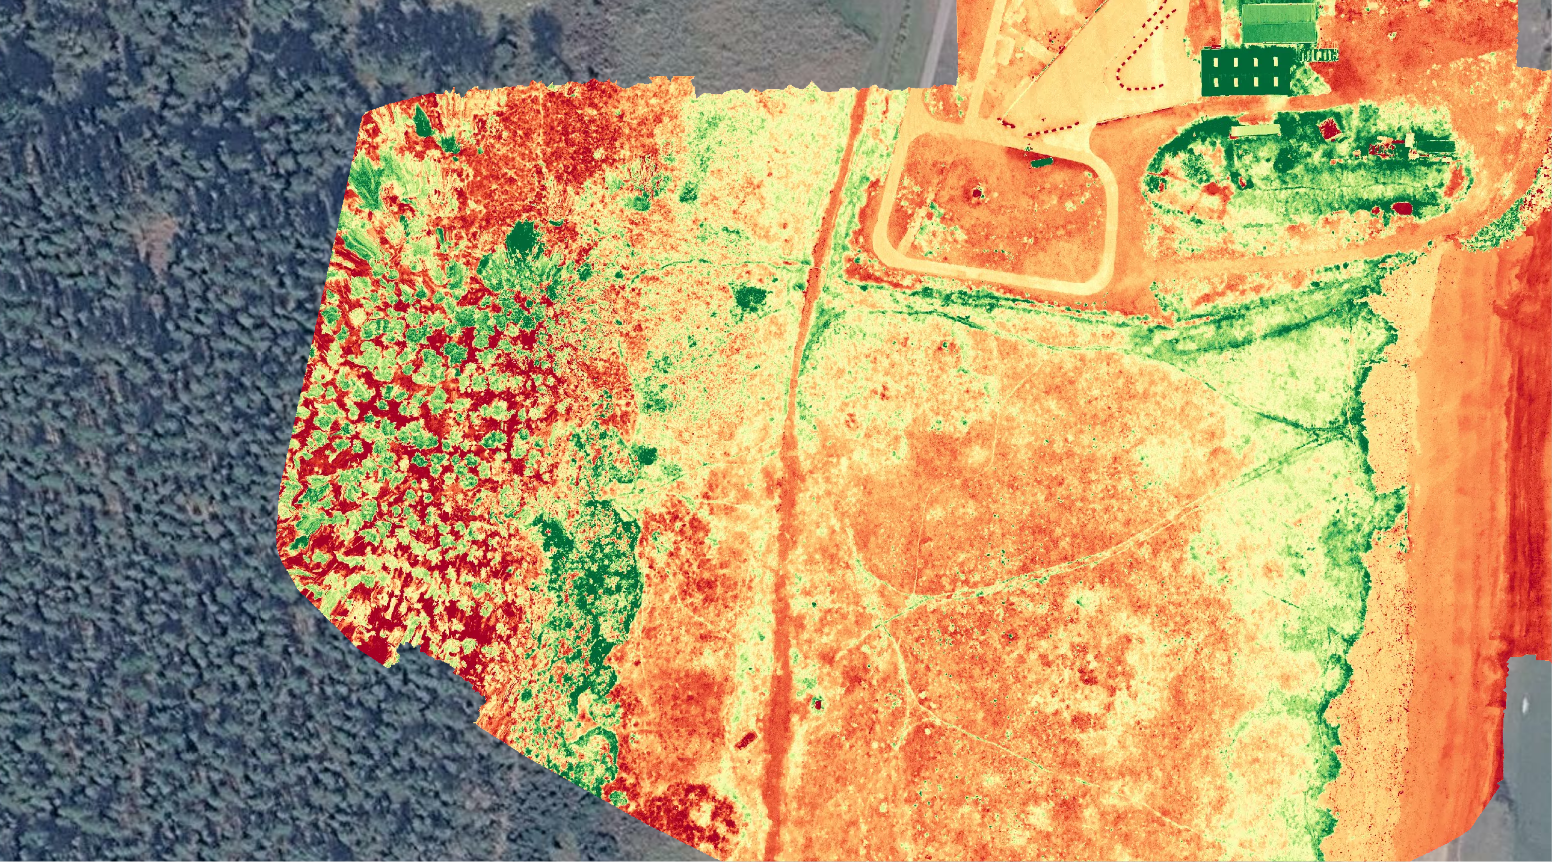
Plant health map (VARI algorithm) composited on Google Maps
The vegetation index is where the survey becomes properly diagnostic. Using an algorithm called VARI, which works with standard RGB drone imagery, the map assigns each patch of vegetation a value based on how photosynthetically active it appears. Vigorous canopy reads green. Stressed or sparse vegetation reads red.
What the map shows at Littleferry is striking. The old commercial plantation on the left is a mosaic of stressed reds and healthier greens, telling a story of a woodland breaking up in old age. The open ground shows lines of vigorous green where drainage channels run beneath the surface, invisible from ground level but revealed clearly from above.
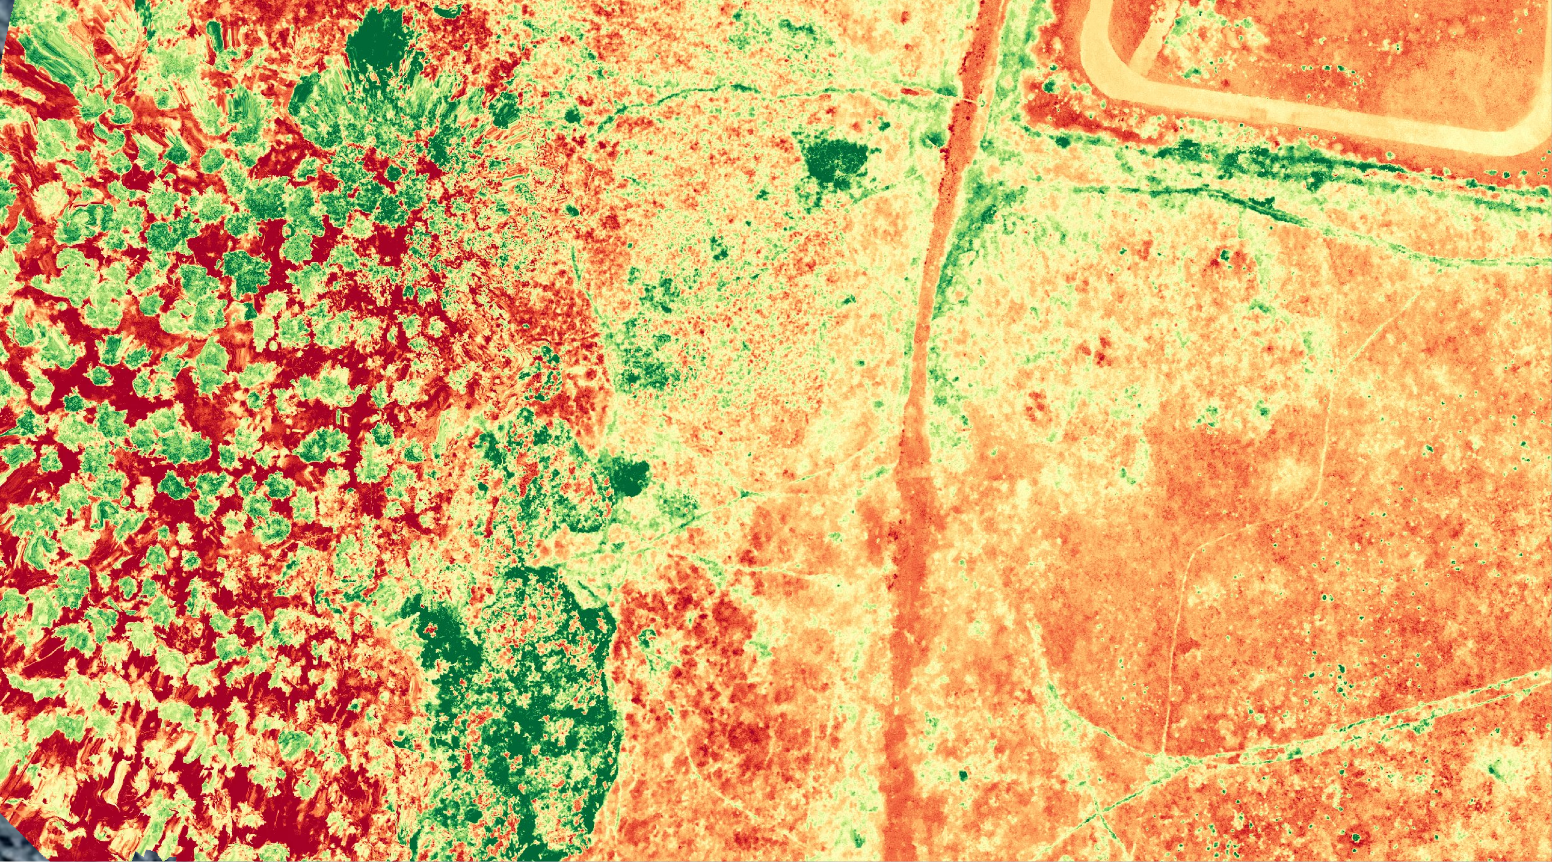
Plant health map (VARI algorithm) close-up
Even more telling is what appears in the enclosed field areas. The stronger green signature along linear features corresponds precisely to buried drainage infrastructure. The stressed orange interiors suggest that drainage system is no longer functioning as it should. Ground that was reclaimed and drained a century ago is quietly reverting.
A century of change
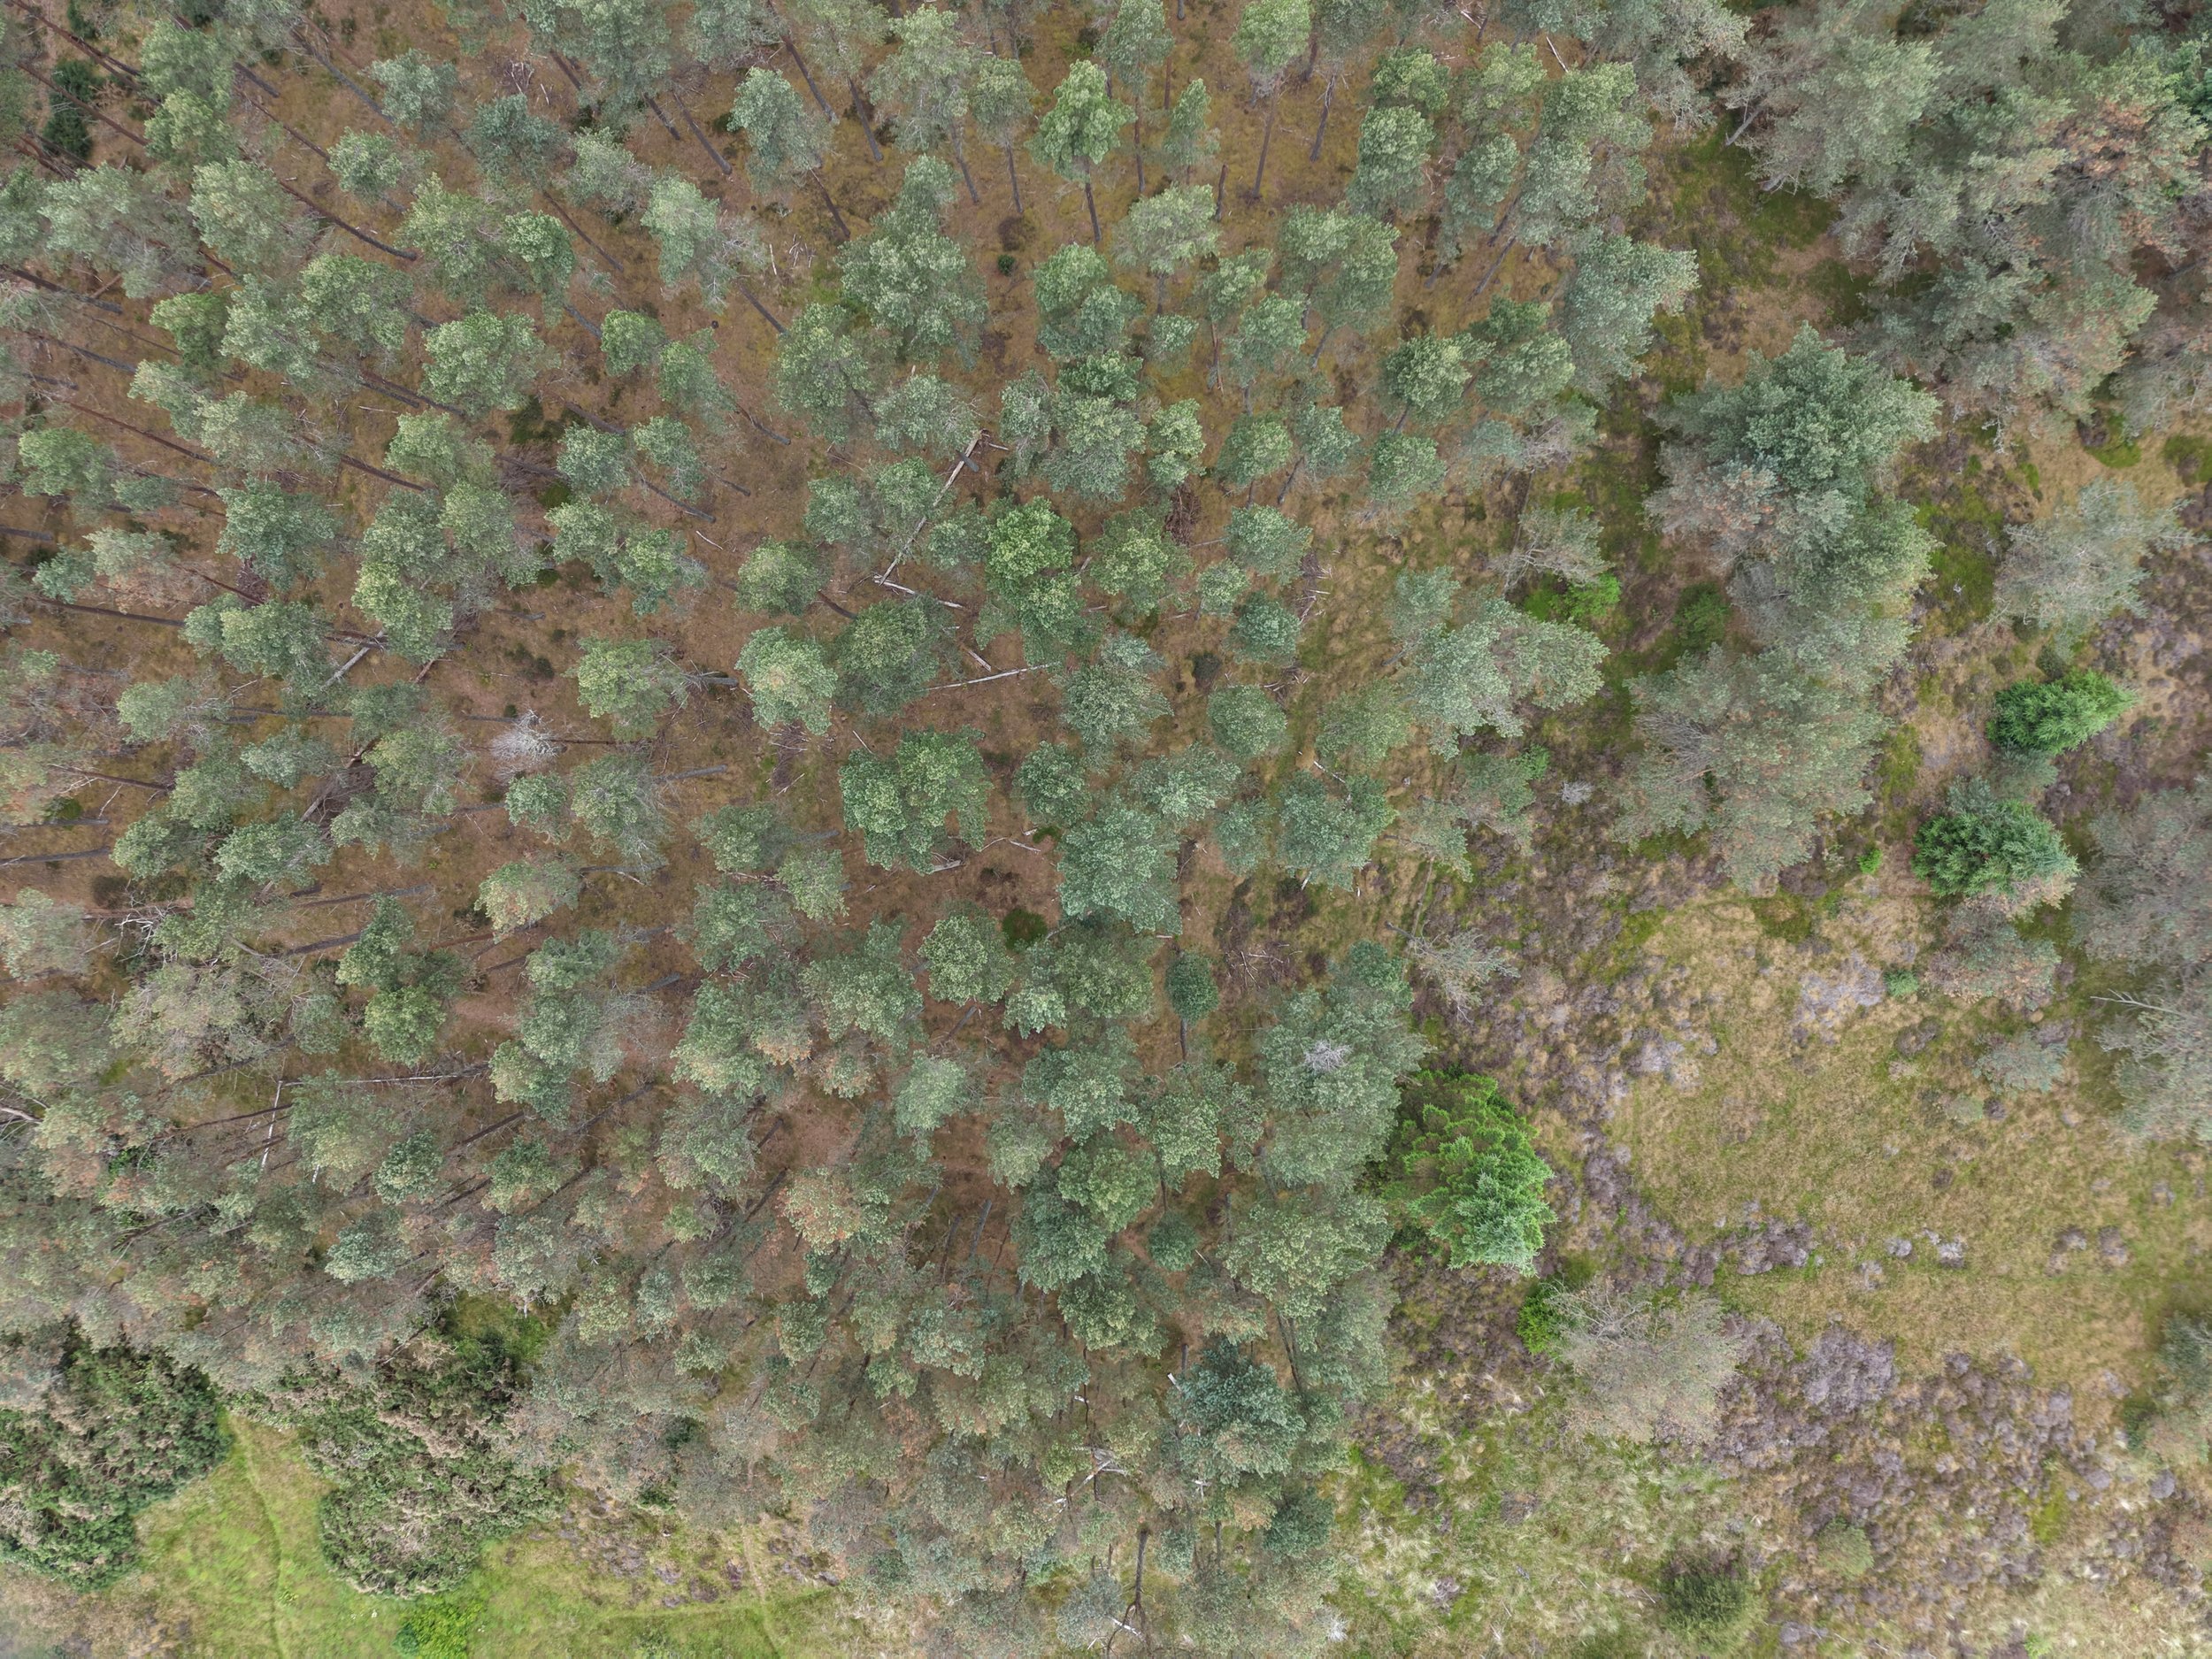
Top-down of the ageing plantation
The plantation itself is a study in landscape change. Historical Ordnance Survey maps date its establishment to between 1902 and 1906, planted on ground that in the 1880s was still open coastal links.
From above, you can see the state of it now. Fallen trunks lying diagonally through the canopy. Bare ground visible between the trees. Crown thinning across the stand. This is a plantation past its commercial rotation age, breaking up on marginal reclaimed soil, with drainage that has probably failed beneath it.
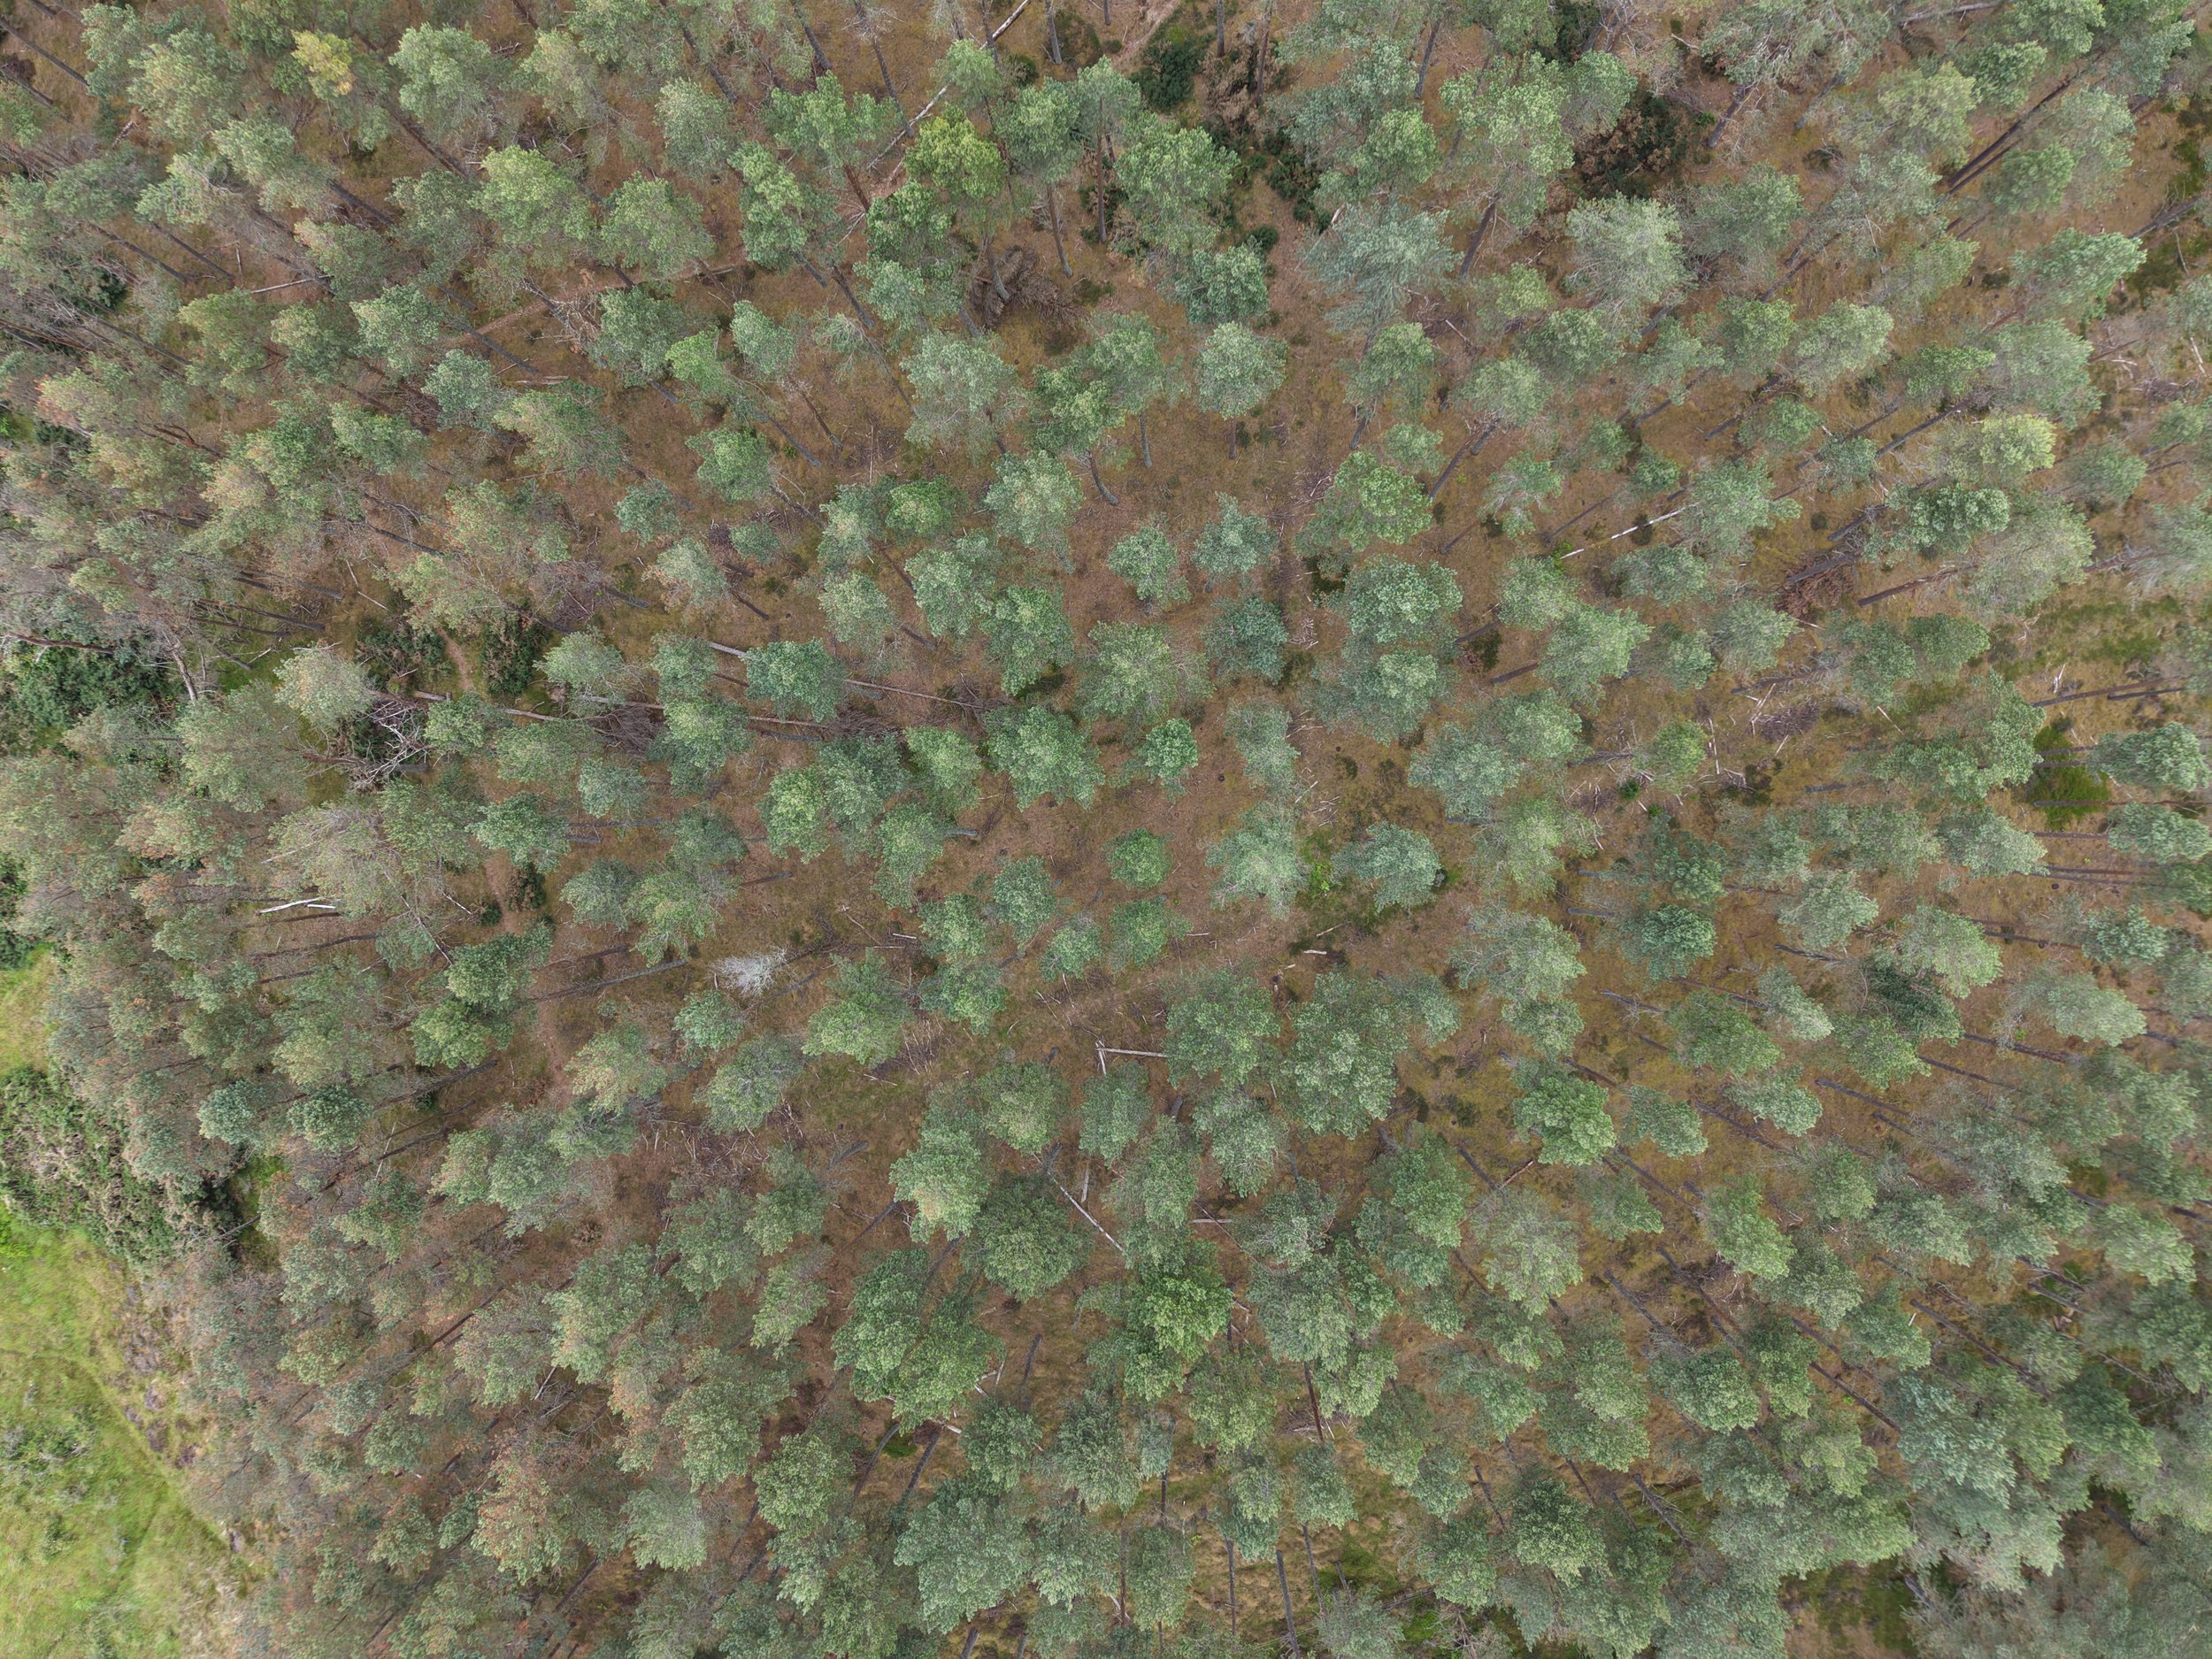
The plantation edge showing regeneration
But there is renewal too. Along the edges where light reaches the ground, natural regeneration is coming through vigorously. Young trees seeding into open ground, unshaded and thriving. The woodland is renewing itself, given time and light.
Why it matters
For an estate owner or land manager, this is more than an interesting exercise. Aerial survey combined with vegetation analysis provides an objective, evidence-based baseline for decisions about a piece of ground. Where is the woodland stressed and why. Where is the drainage failing. What is regenerating naturally and where. What was the historical land use, and how is that still shaping the site today.
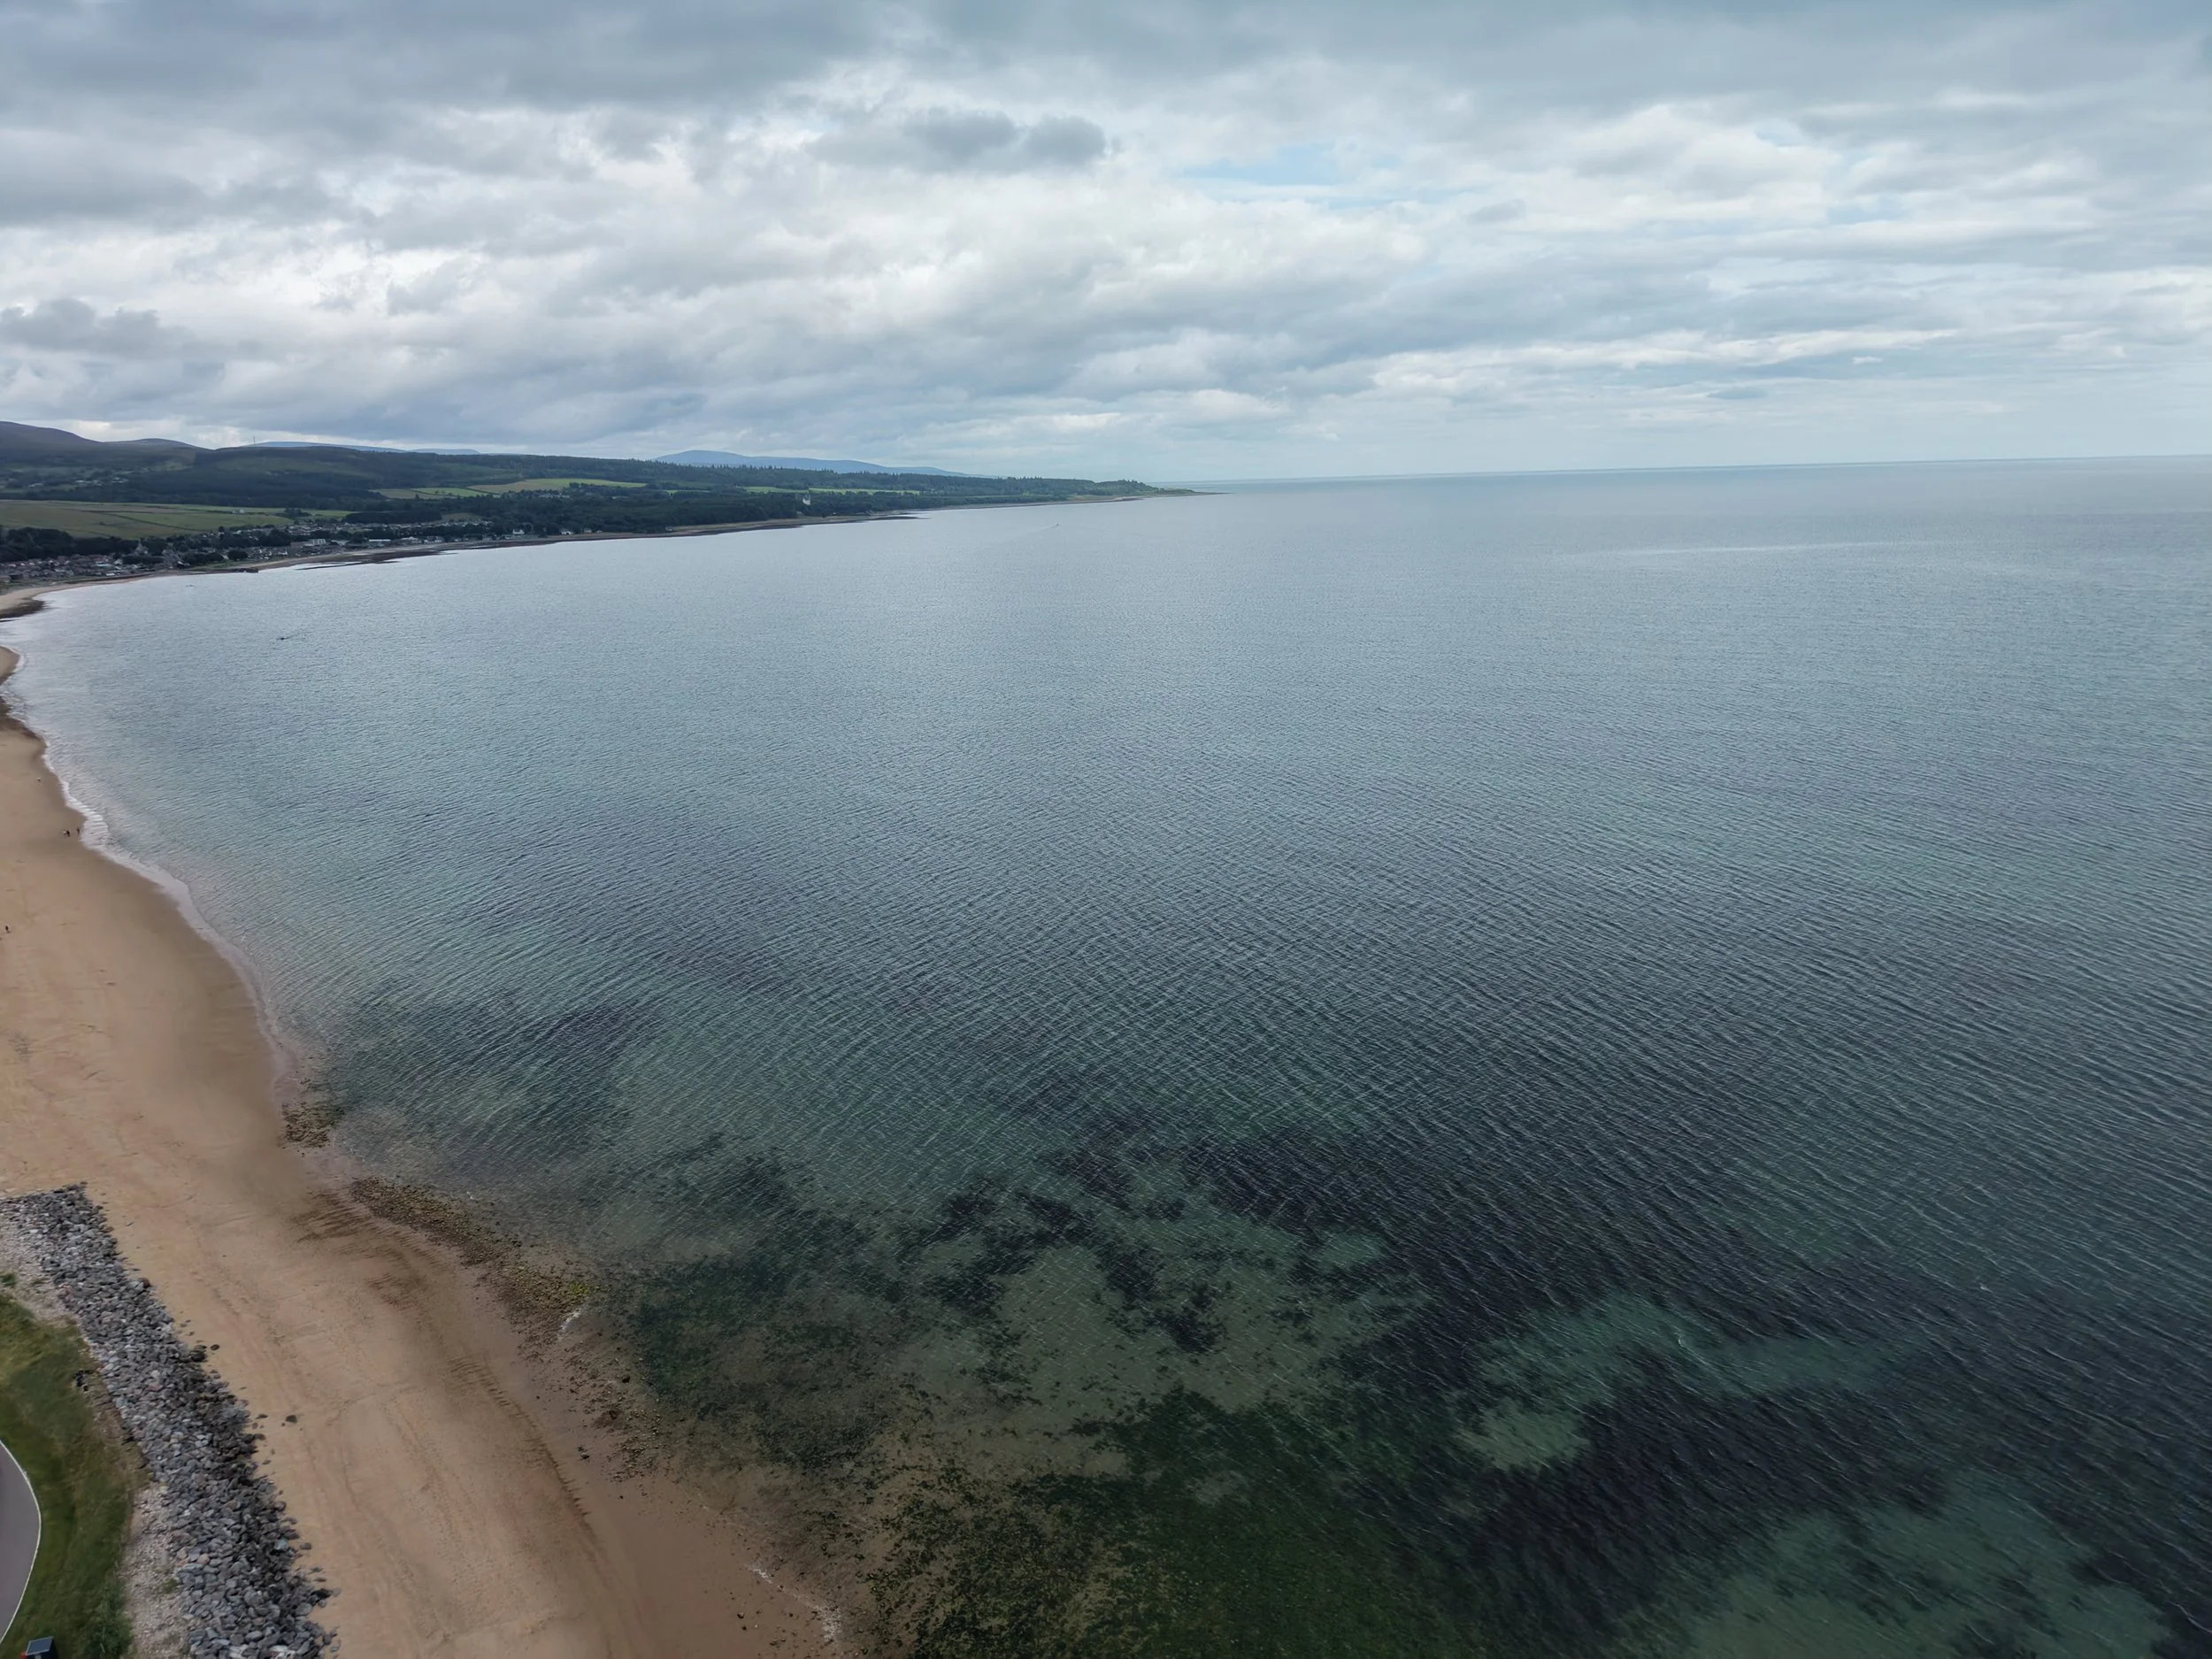
Sutherland coast looking north
None of this is theoretical. Every question was answered here in a single morning's flying, on one piece of Highland coast. The methodology scales. The same approach applied to a rural estate, a heritage landscape, or a designed woodland delivers the same clarity of insight.
The technology has become genuinely accessible. What matters now is the eye reading it.
MacDonald Horticulture offers aerial survey and canopy diagnostics for rural estates, heritage landscapes, and land trusts across Scotland. To discuss a survey of your ground, get in touch.